
Predicting probability of winning of chasing team in cricket using machine learning algorithms

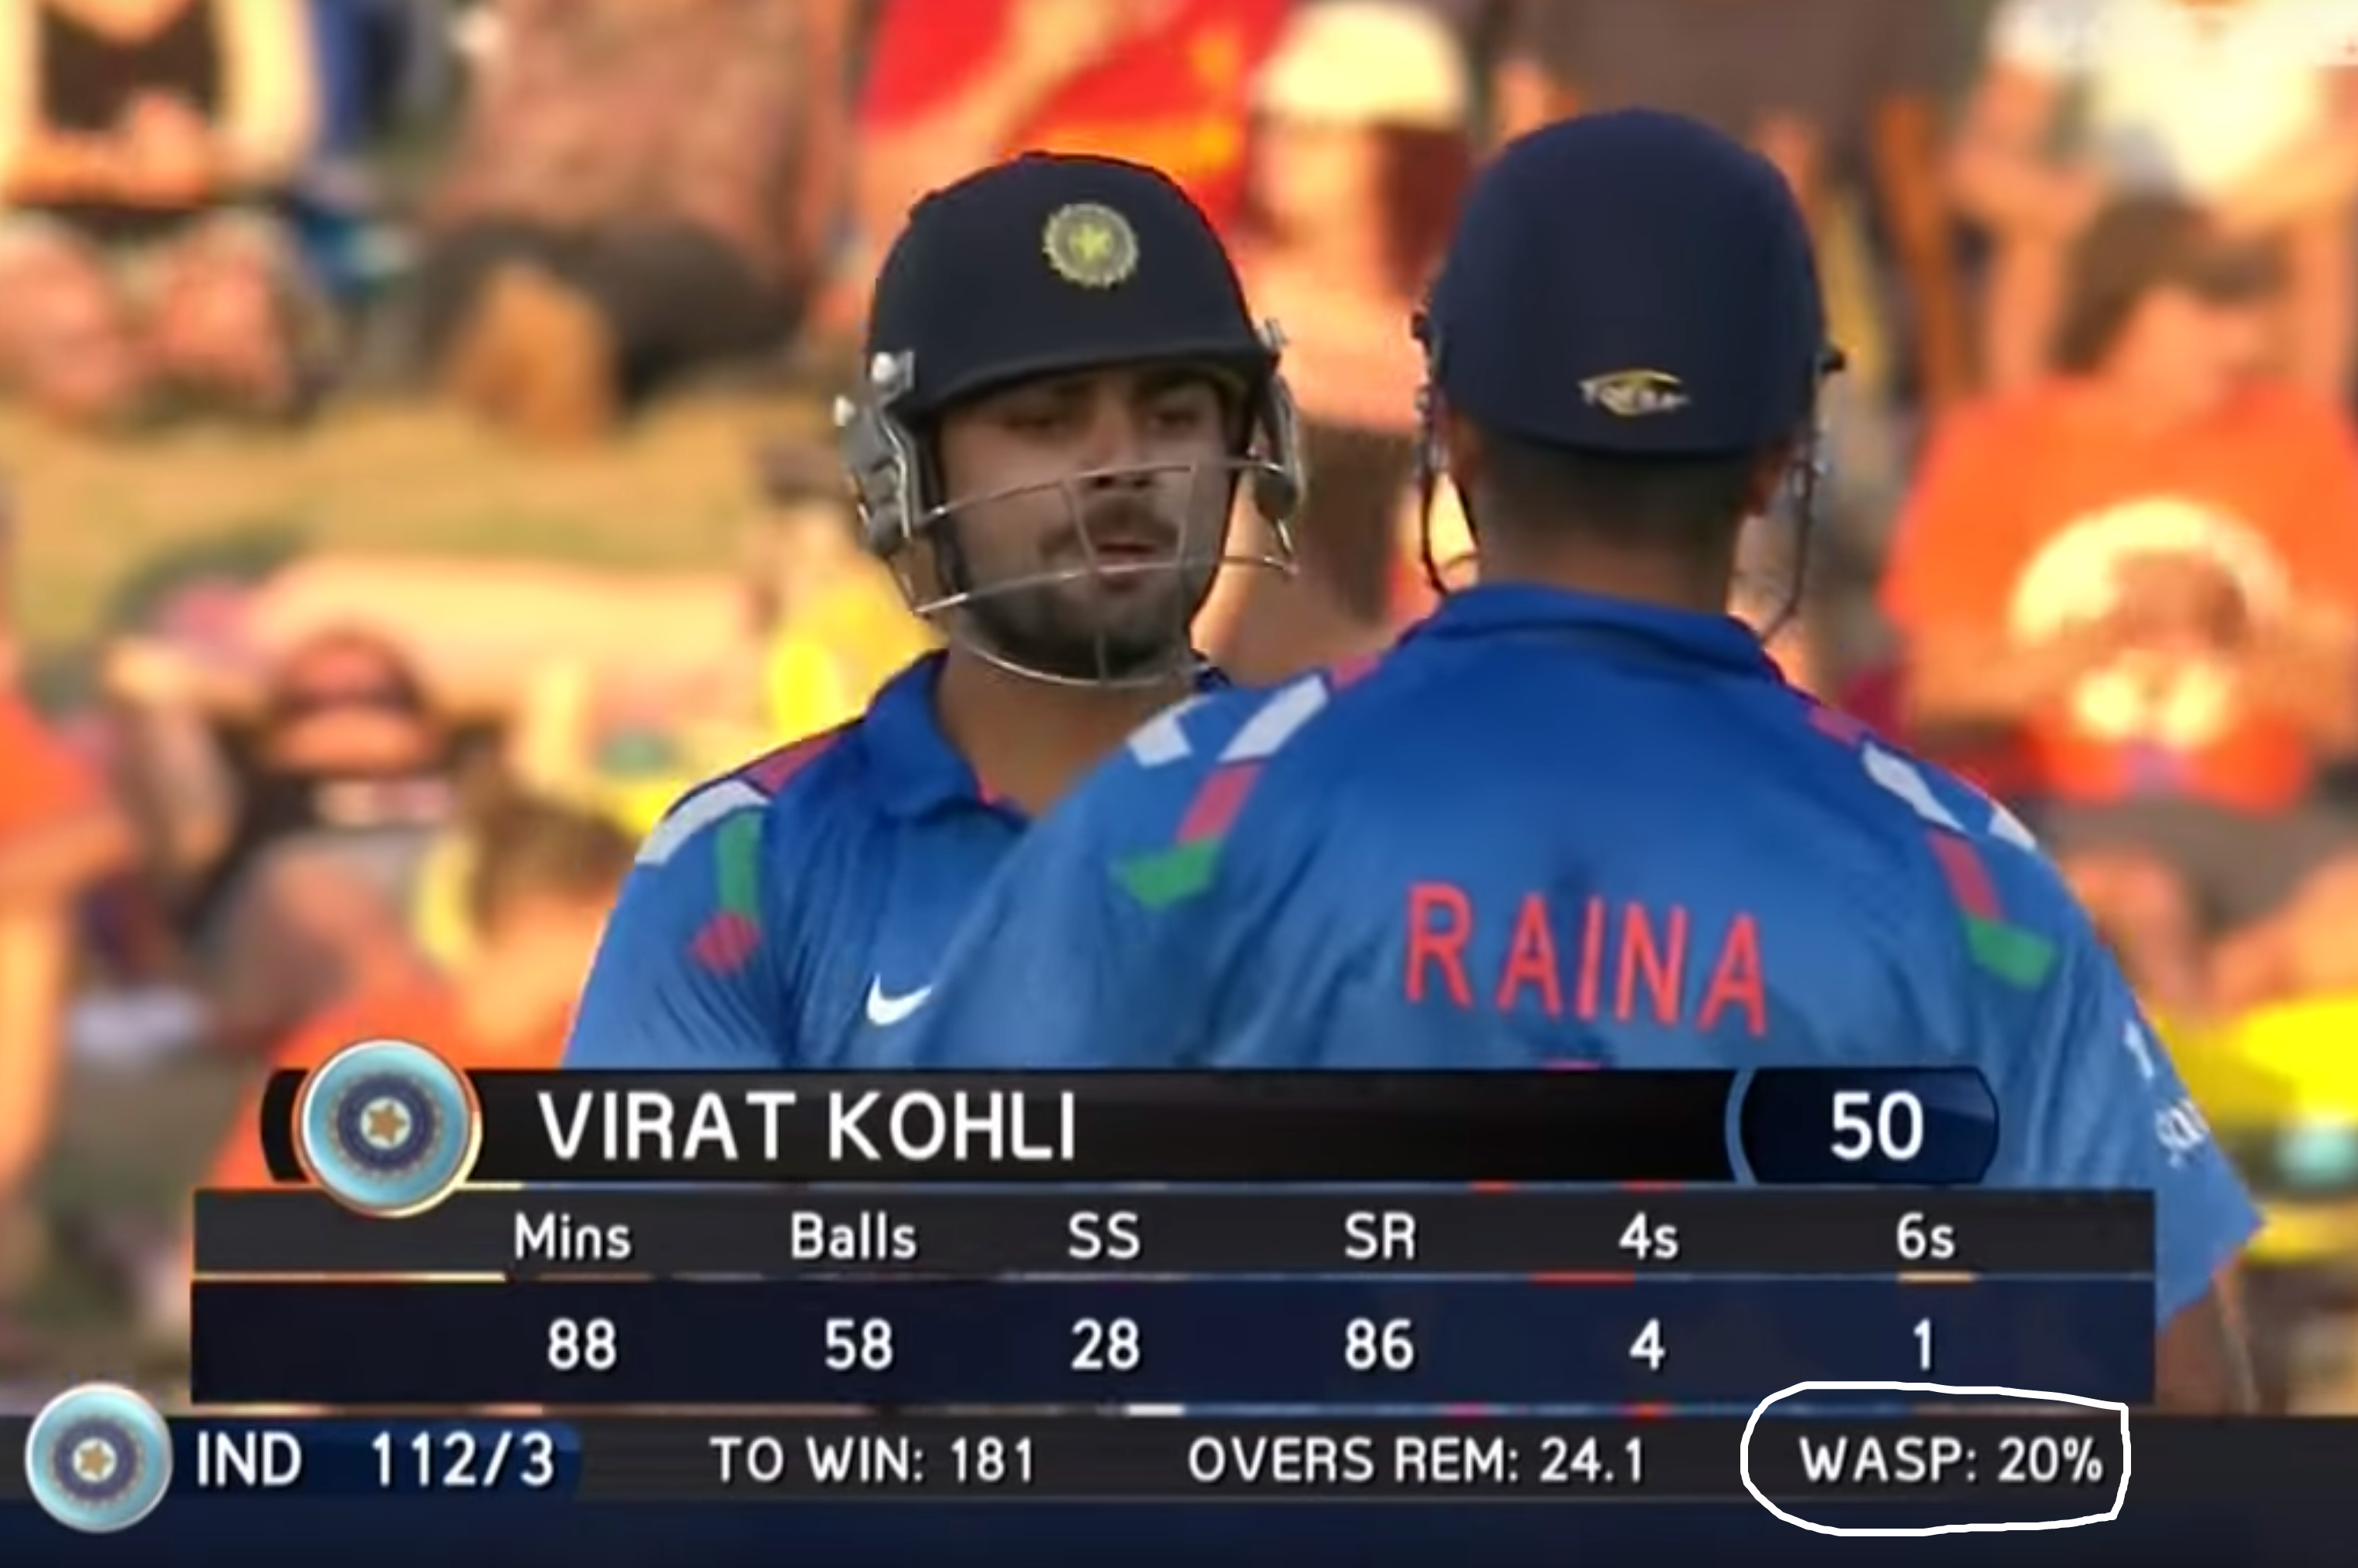
You would have seen Winning and Score Predictor(WASP) tool being used in matches that happens in New Zealand. This predicts the final score of team batting first and probability of winning for the team batting second.
WASP uses data from past matches to arrive at a particular model for prediction. We will also be using data from the past matches to create the prediction model. In ODI and T-20 cricket, many factors play a key role in deciding whether the chasing team will win or lose. Let’s look at some of the key factors:
- Target for the chasing team
- Number of wickets left
- Number of balls left
- On how much scores are the current batsman batting?
- How much the team had scored in last 5 overs?
- How much the team had lost wickets in last 5 overs?
- The nature of the pitch
- How strong is the batting and bowling team?
I will use some of these factors to predict probability of winning of chasing team using machine learning algorithms. We use logistic regression algorithm in machine learning to predict predict probability of winning of chasing team in ODI or T-20 match.
Preparing the dataset
I have not scrapped the web pages to prepare the dataset. I have downloaded the dataset from cricsheet. The site gives us ball by ball details of matches. I then wrote a custom code to only include some of the features which I will be using.
The dataset contains ball by ball coverage of:
- ODI matches: data/odi.csv
- T-20 matches: data/t20.csv
- IPL matches: data/ipl.csv
Each dataset consists of following columns(features):
- mid: Each match is given a unique number
- date: When the match happened
- venue: Stadium where match is being played
- bat_team: Batting team name
- bowl_team: Bowling team name
- batsman: Batsman name who faced that ball
- bowler: Bowler who bowled that ball
- runs: Total runs scored by team at that instance
- wickets: Total wickets fallen at that instance
- overs: Total overs bowled at that instance
- runs_last_5: Total runs scored in last 5 overs
- wickets_last_5: Total wickets that fell in last 5 overs
- striker: max(runs scored by striker, runs scored by non-striker)
- non-striker: min(runs scored by striker, runs scored by non-striker)
- total: Total runs scored by batting team after first innings
Importing the dataset
import pandas as pd
# Importing the dataset
dataset = pd.read_csv('data/%.csv'%(match_type))
X = dataset.iloc[:,[7,8,9,12,13,14]].values #input features
y = dataset.iloc[:, 15].values #label/output
I have used ‘odi.csv’ datafile here for predicting probability. One can use ‘t20.csv’ or ‘ipl.csv’ if they want to predict probability for T-20 matches or IPL matches respectively.
Features Used:
- runs
- wickets
- overs
- striker
- non-striker
- target
Why didn’t I use other features?
While experimenting, all the other features didn’t make much difference in results. You can use a different combination of features and test the code on them.
Label Used: Win/loss(win-1,loss-0)
Splitting data into training and testing set
from sklearn.model_selection import train_test_split
X_train, X_test, y_train, y_test = train_test_split(X, y, test_size = 0.25, random_state = 0)
We will train our model on 75 percent of the dataset and test the model on remaining dataset.
Feature Scaling the data
from sklearn.preprocessing import StandardScaler
sc = StandardScaler()
X_train = sc.fit_transform(X_train)
X_test = sc.transform(X_test)
Feature scaling is a very important part of machine learning. You can read more about it here
Training the datase
from sklearn.linear_model import LogisticRegression
lin = LogisticRegression(random_state=0, solver='lbfgs',multi_class='multinomial')
lin.fit(X_train,y_train)
Testing the dataset on trained model
y_pred = lin.predict(X_test)
score = lin.score(X_test,y_test)*100
print("R Square Value: " , score)
R-squared value: R-sqaured is a statistic that will give some information about the goodness of fit of a model. In regression, the R-squared coefficient of determination is a statistical measure of how well the regression predictions approximate the real data points. An R-squared value of 1 indicates that the regression predictions perfectly fit the data.
Testing with a custom input
import numpy as np
new_prediction = lin.predict_proba(sc.transform(np.array([[100,2,10,23,52,200]])))
print("Prediction score:" , new_prediction[0][1]*100)
Results
| Dataset | R-squared |
|---|---|
| ODI | 81.7 |
| T-20 | 77.85 |
| IPL | 76.9 |
Code and dataset
https://github.com/codophobia/CricketChasingProbability

Leave a comment